
Only logged in customers who have purchased this product may leave a review.
Multifocal VEP And ERG
Product Specification
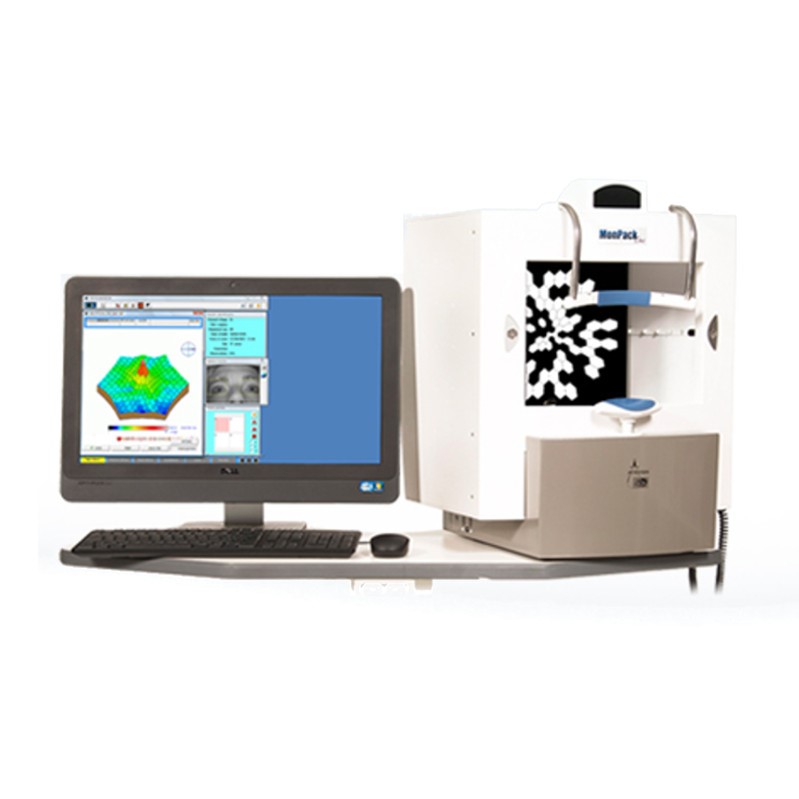
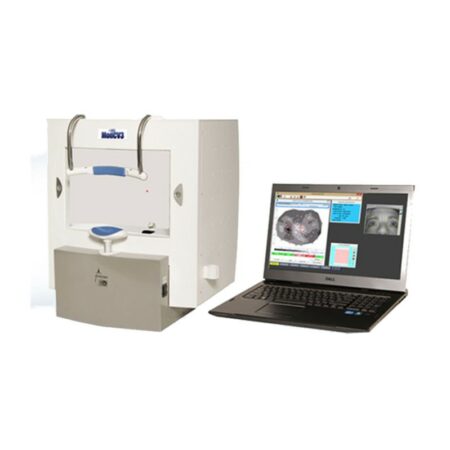
Universal stimulator Monpack
- very high luminance (400 cd/m2) which allows to obtain high amplitude responses with optimal quality and reduced examination time.
- control of the peripheral luminance (surrounding of the stimulation) which eliminates the contamination of ERG responses by rod photoreceptors.
- fixation monitoring with a high resolution video camera.
- visual field covered by the stimulation: up to 30 degrees in eccentricity.
- stimulation distance (eye – screen distance): 30 cm.
- high frame rate (120 Hz) allowing a high accuracy for the temporal analysis of responses.
- stimulation frequency (18 Hz) preserving the morphology of ERG responses by reducing temporal interferences.
Stimulations
The number of stimulation zones is comprised between 19 and 217. For 61 stimulation zones, the typical recording time varies from 60 to 300 seconds, depending on the cooperation of the patient. The number of stimulated zones must be a compromise since, as this number increases, the accuracy of fixation and the recording time increase. The shape of stimulation zones is hexagonal. Their size increases from the fovea to the periphery to obtain local responses of approximately constant amplitude (their amplitude depends on the density of photoreceptors).
Zones of uniform size are also available when the density of photoreceptors is abnormally distributed (central scotoma for example) or eccentric fixation.
Map of local responses
During the exam, the program displays in real time the local responses with an automated identification of the N1, P1 and N2 peaks of each response. The quality of the recorded signal is evaluated by computing the noise level and displaying the signal evolution since the beginning of the recording (base line).
In the example hereby, the base line appears very unstable at the beginning of the exam, which is frequently due to eye movements, eye blinks or electrode instability. After about 1 minute, the baseline becomes stable and the noise level indicates that the quality of result is sufficient for a valid interpretation.
2D and 3D maps
The program allows to display 2D and 3D interpolated maps of the amplitude and implicit time of the N1, P1 and N2 peaks of the local responses.
There are no reviews yet.